European Exposure to Chinese Power
The China Exposure Index (2013−2025), Europe Edition
The China Exposure Index (CEI), ranking 184 countries from 2013 to 2025 on how exposed they are to Chinese power, finds a surprising concentration of Chinese power in Europe.
China’s rapid political and economic ascent is one of the defining trends of our time, with media headlines regularly trumpeting Beijing’s increased global presence. But we have surprisingly little systematic information on how Chinese power — understood as China’s latent capacity to influence — is actually distributed across the globe. CEI fills that gap, ranking the exposure of 184 countries to Chinese power between 2013 and 2025. The CEI uses transparent, open-source data on indicators of Chinese capacity to conduct coercive statecraft, economic co-optation and diplomacy — ranging from Chinese Foreign Direct Investment (FDI) and exports to China to the presence of Chinese military power and number of Confucius Institutes. The CEI’s time frame covers the tenure of China’s leader and General Secretary of the Chinese Communist Party Xi Jinping, tracking the expansion and partial contraction of global Chinese power in a period defined by the United States’s (US) recalibration of its relationship with the world, as well as China’s shift towards a more assertive foreign policy.
This report is a limited release where we focus on presenting the CEI’s Europe results with reference to the global Top 15 (2025). Further reports will present results from other regions.
Amidst a wide range of findings, this release generates seven key insights about exposure to Chinese power.
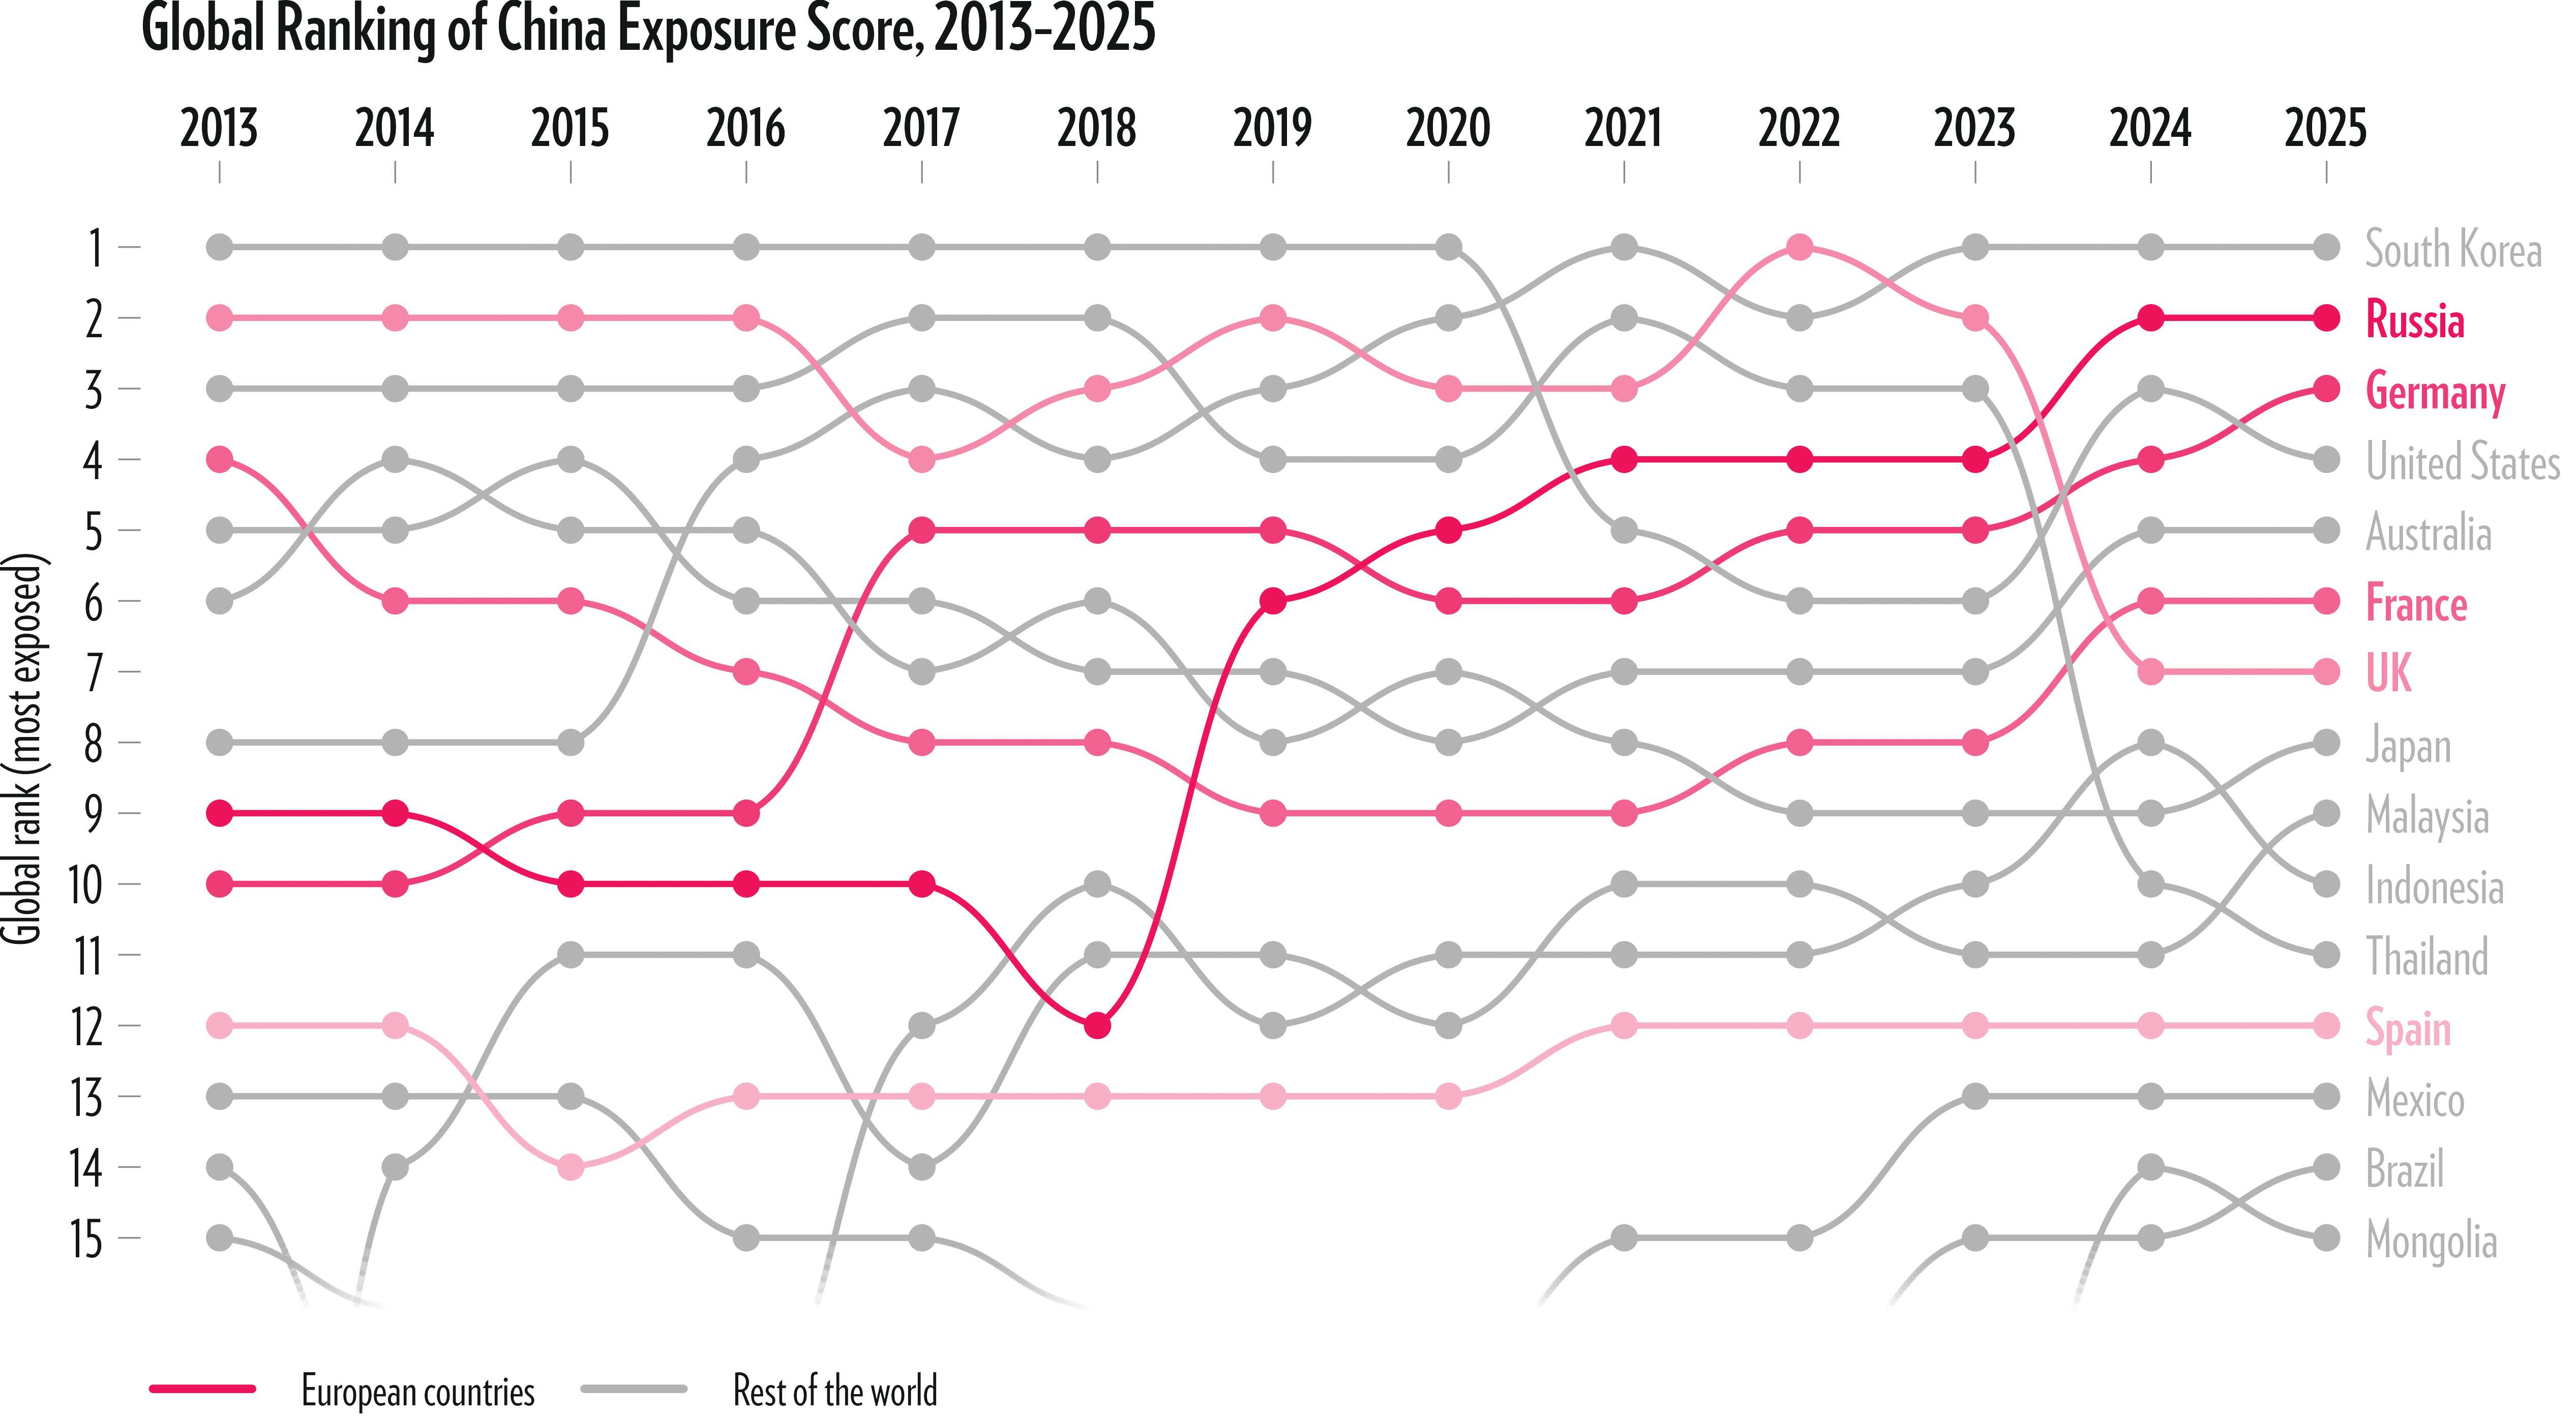
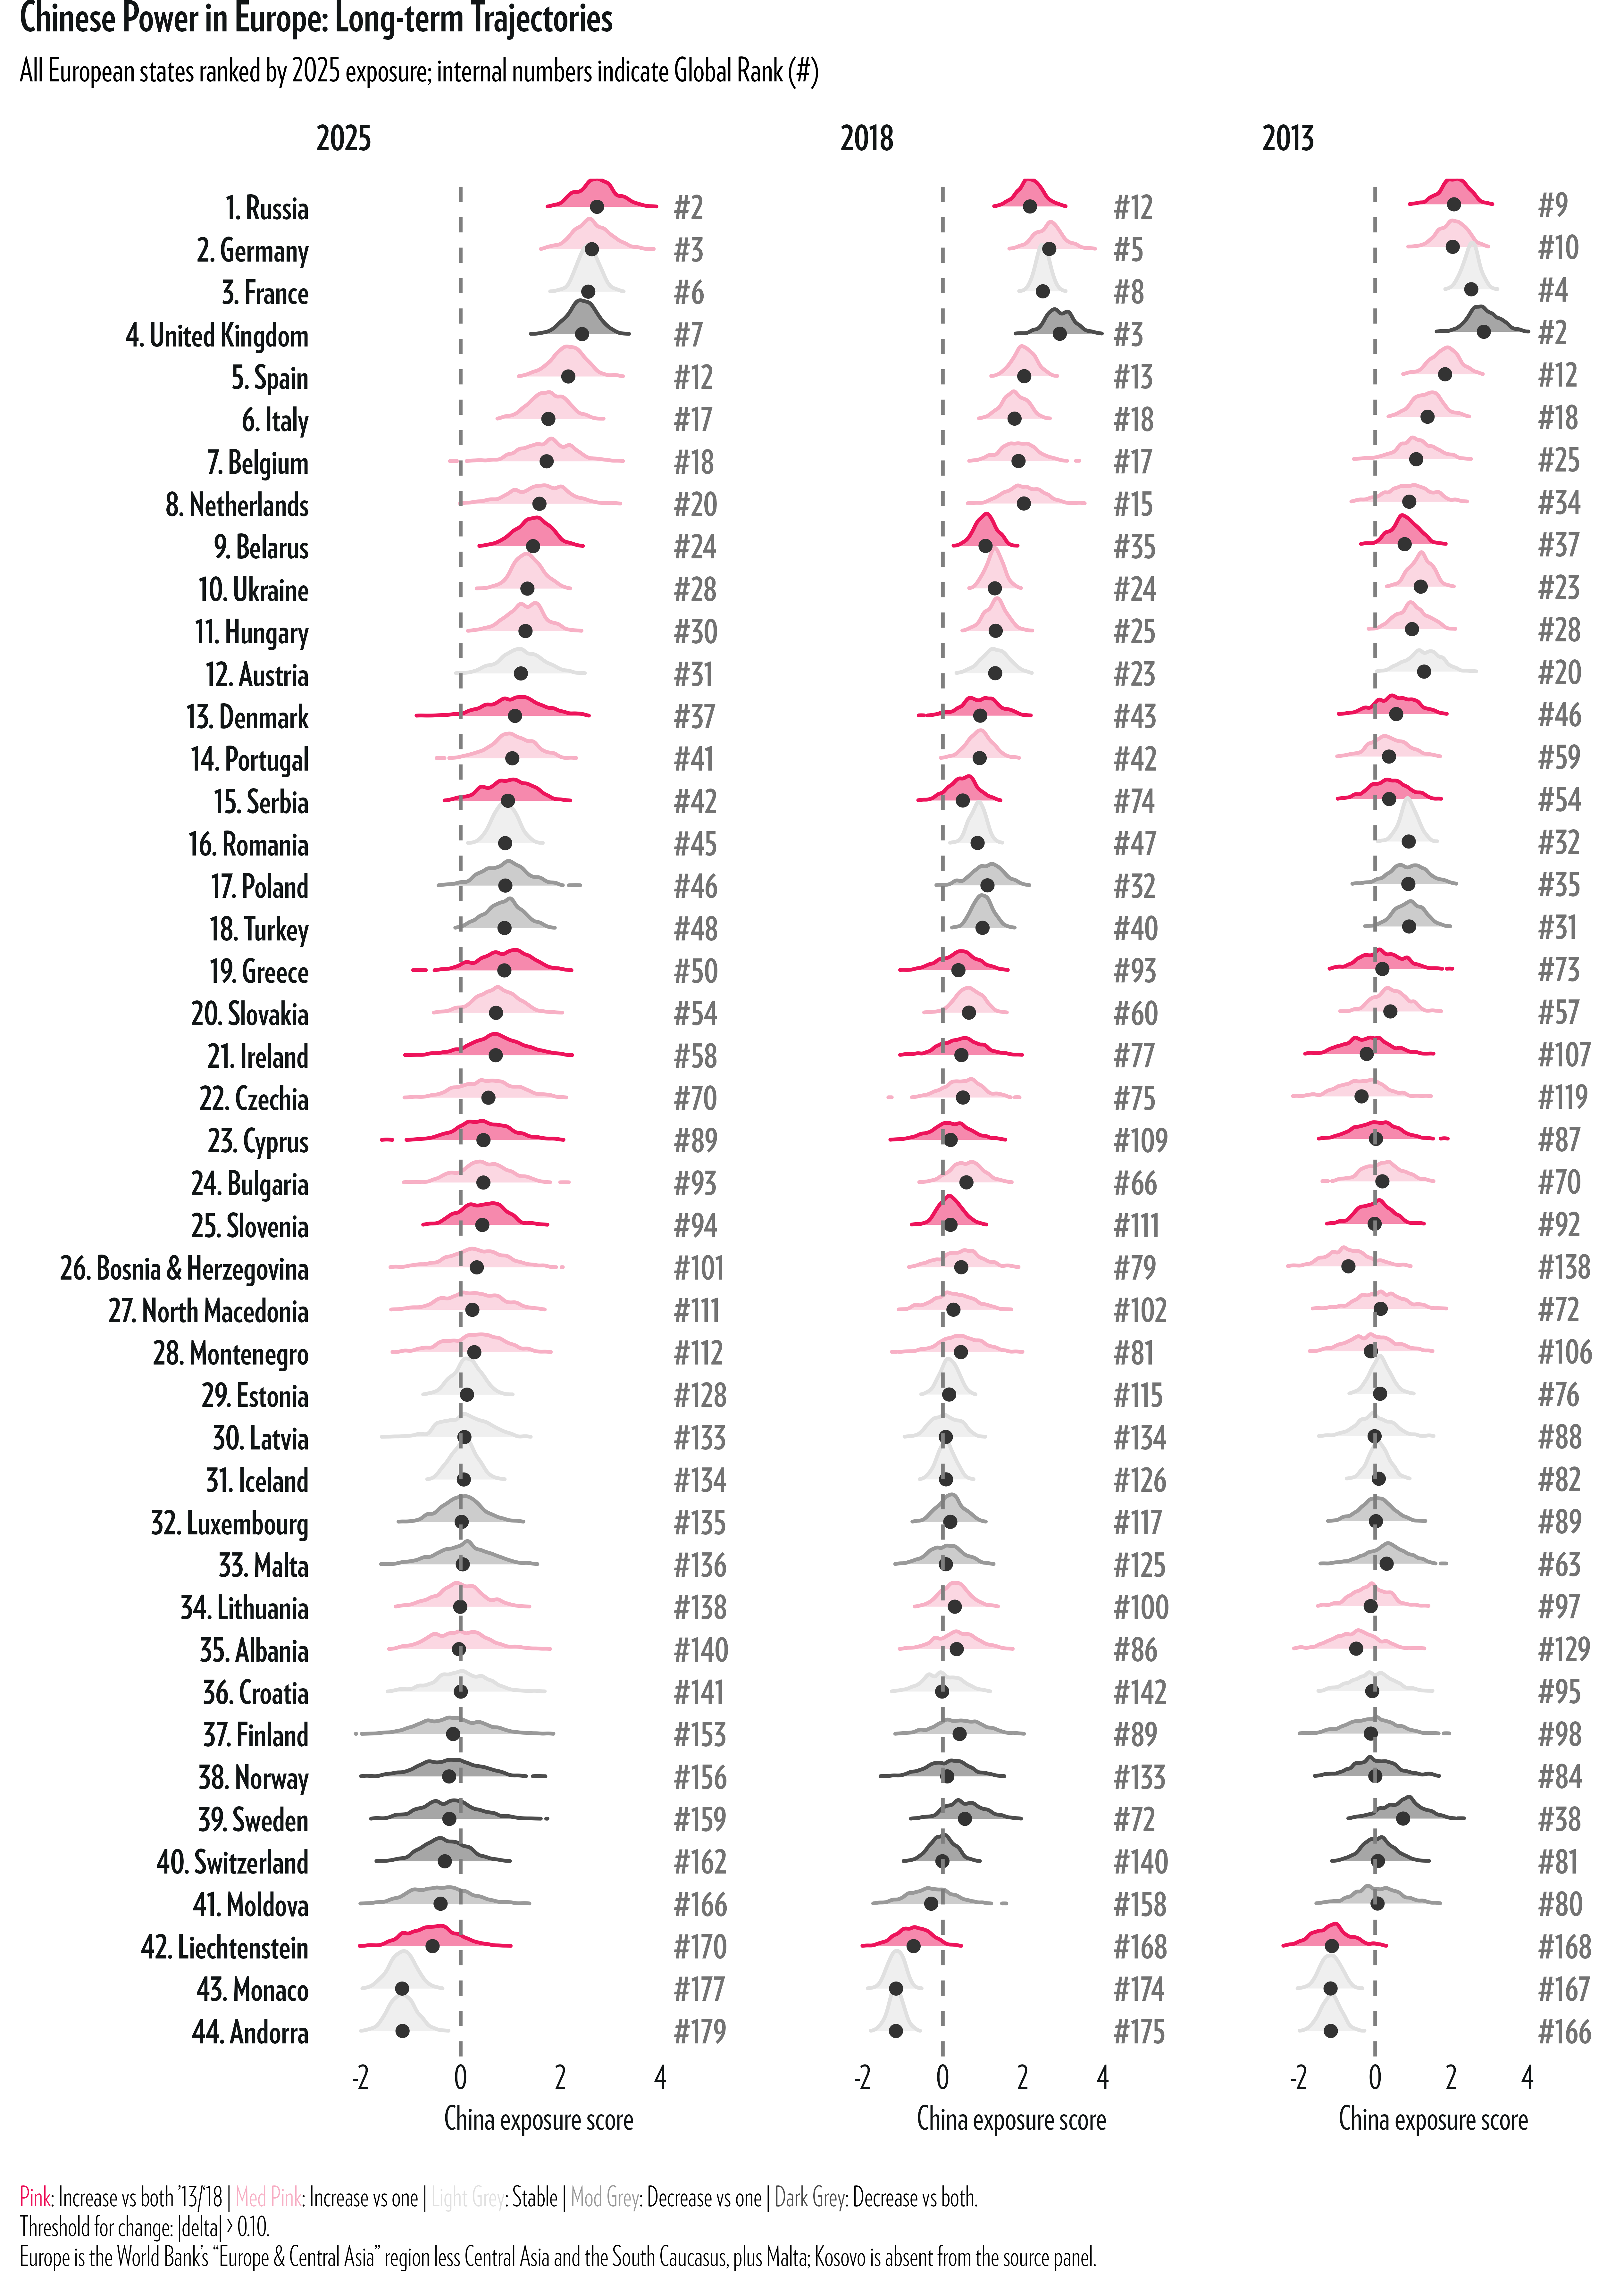
Four of the seven most exposed countries in the world are in Europe: Russia (#1 in Europe, #2 globally), Germany (#2, #3 globally), France (#3, #6 globally) and the United Kingdom (UK, #4, #7 globally). Perhaps surprisingly, these states are substantially more exposed than countries commonly associated with Chinese dominance, such as Thailand (#11) and Mongolia (#15). South Korea ranks first globally, with the United States (US, #4) and Australia (#5) completing the Top Seven. Moreover, Europe’s average China exposure score in 2025 exceeded the world average and trailed only the Indo-Pacific. These results are noteworthy; they fly in the face of the common assumption that exposure to Chinese power is most acute in the ‘developing world.’ And they contradict the expectation that exposure to Chinese power would be significantly less in Europe than in the Indo-Pacific, given Europe’s geographical insulation from Chinese military reach. The CEI thus highlights how the global diffusion of Chinese power not only rests on its military strength, but also flows from China’s economic ties and public diplomacy efforts.
The countries most exposed to Chinese power are overwhelmingly democracies — contrary to the expectation that China’s power would be greatest over states with more authoritarian and corrupt systems. Fourteen of the Top 15 countries are democracies, with Russia as the sole exception. The US, the traditional liberal democratic superpower, ranked #4 globally in terms of exposure to Chinese power, despite recent declines that started under Trump’s first term and continued under Biden; US ranking was #1 globally in both 2013 (start of Xi’s first term as PRC president) and 2018 (start of Xi’s second term as PRC president). There are two potentially complementary readings of this concentration of Chinese power in democracies. First, many democracies are states with advanced economies, and they have often sought trade and financial ties with China for economic benefits, which gives Beijing critical leverage. The second explanation for this surprising correlation is that China might be systematically targeting democracies, precisely because their values and policies diverge from Beijing’s. If a country’s political preferences already align with China’s, it does not need to be forced into alignment and therefore there is less pressing need for China to build up power.
The five European countries ranked highest by the CEI highlight different routes of exposure to Chinese power. These countries score fairly high on all indicators, but there are important differences in their profiles. Russia represents a classical trade story: Russian exports to China rose from 1.6 percent of Russia’s Gross Domestic Product (GDP) in 2013 to a peak of 5.4 percent in 2023. By 2025, exports had slipped to 4.2 percent, but still the highest share in Europe. Both France’s and the UK’s exposure scores, on the other hand, reflect the centrality of Chinese public diplomacy within China’s global reach: the two countries host more Confucius Institutes than almost any other country in the world. Officially designed to promote Chinese language and culture, Confucius Institutes have been accused of facilitating espionage and engaging in activities from monitoring Chinese students abroad to pressuring universities to censor discussions on sensitive topics such as Taiwan. Wary of their possible roles in expanding Chinese state influence, several European states have recently moved to close (some) Confucius Institutes. Spain (coming in at #5 in Europe and #12 globally) combines the trade and the Confucius Institutes stories with a third Chinese FDI story: (1) Spain’s imports from China have nearly doubled since 2013, to a share higher than either Germany’s or the UK’s imports (as a percentage of GDP); (2) Chinese FDI has risen roughly ninefold, from $0.8 billion to $7.3 billion; and (3) Spain’s Confucius Institute network has grown from six to 10.
Europe’s regional exposure to China increased from 2013 to 2020, but it has shrunk since, amid the EU recasting China as a systemic rival in 2019, the COVID-19 pandemic, Russia’s invasion of Ukraine, which sharpened EU awareness of strategic dependence, and Brussels officially adopting a “de-risking” approach to China. Italy’s withdrawal from the Belt and Road Initiative (BRI) in December 2023 symbolically capped this period. But Europe’s retreat is modest: it remains significantly more exposed today than it was in 2013.
There are clear regional differences within Europe. Exposure is highest across the European heartland (within both the eastern and western cores), and lowest along the northern flank, among the Baltic and Scandinavian states.
The three countries that register the sharpest increases in exposure to Chinese power (in the period between 2013 and 2025) are Bosnia and Herzegovina, which climbed from #41 in Europe to #26 (and from #138 in the world to #101), Czechia (Europe: from #39 to #22; World: from #119 to #70) and Ireland (Europe: from #38 to #21; World: from #107 to #58). Ireland, currently holding the presidency of the Council of the EU, is a particularly significant case: it is Europe’s technology hub, home to a dense concentration of American firms. Chinese FDI in Ireland was statistically non-existent in 2013, but reached 4.6 percent of Ireland’s GDP by 2020, standing at 2.7 percent in 2025, roughly accounting for $19.4 billion. Chinese tech and pharmaceutical firms have used the country as a beachhead into the EU market: WuXi Biologics built a 325-million-euro plant in Dundalk, its first outside China, and TikTok opened its first European data center in Dublin.
- The CEI also documents how certain European countries have managed to reverse their exposure to China. Sweden records the largest decline of any European country, falling from #16 in Europe to #39 (Global: from #38 to #159). An illustrative anecdote of Sweden’s change of heart: amidst the collapse in the country’s diplomatic relations with China over the detention of Chinese-Swedish publisher Gui Minhai, Sweden closed all its Confucius Institutes by 2020, the first European country to do so. We also observe notable reversals in Moldova (Europe: from #26 to #41; Global: from #80 to #166), Norway (Europe: from #29 to #38; Global: from #84 to #156), Switzerland (Europe: from #27 to #40; Global: from #81 to #162), and the UK (Europe: from #1 to #4; Global: from #2 to #7).
Overall, the CEI produces some surprising findings. But what statistically grounds the numbers and makes them convincing? Compared to traditional indices of national power, the CEI relies heavily on computer simulations to calculate the weights of the indicators rather than having the research team simply set those weights in advance. The CEI’s rankings therefore do not rely on arbitrary, analyst-selected weights — that’s one of this index’s major strengths. Additionally, the computational statistical method behind the CEI ensures that the index remains valid even if data for some indicators are missing (because certain data points are not available, for example) while allowing a country’s whole trajectory to inform each year of its score. The latter point is important, as power shifts slowly and historical trends matter.
It is important to keep in mind that power is distinct from both influence and alignment. Power is the latent capacity for one actor to influence another. Influence flows from a successful assertion of power to generate actual real-life preferences or policies. Alignment is where two countries share the same preferences. Crucially, the CEI measures Chinese power, not Beijing’s influence or countries’ alignment with Beijing. A country can be less exposed to Chinese power, yet align strongly with Beijing — this is the case with, for example, Serbia. Widely regarded as one of China’s closest partners in Europe, Belgrade was the first European capital to endorse Xi’s vision of a ‘community of shared future.’ But Serbia ranks only #15 in Europe and #42 in the world. Because Serbia is already so aligned with Beijing, its exposure score is lower than perhaps expected; Beijing has less need to build up power when preferences already converge. And of course, a country can be highly exposed to Chinese power, yet resist Beijing’s preferences. A case in point: Europe’s most exposed states are large democracies that are not traditionally aligned with Beijing.
When a European country’s exposure to Chinese power is high but alignment of preferences is low, it has three options: (1) adjust its policies in line with Beijing’s preferences to avoid Beijing’s future displeasure, (2) work to reduce Beijing’s capacity to influence, but at the cost of confronting China today, and (3) do nothing and hope the situation will improve by itself. The larger this power-alignment gap, however, the less feasible the ‘do-nothing’ strategy becomes, and the more likely that the European state will either contest or accommodate Chinese power. CEI Europe 2025 concretizes these abstract points by objectively quantifying the differential challenge posed to European policymakers by exposure to Chinese power.
If you would like access to the data, please request it at ntuccs@ntu.edu.tw.
This report was published together with Mercator Institute for China Studies (MERICS) and National Taiwan University (NTU, Center for China Studies). It was featured in the Financial Times (FT) on September 24, 2026.